Singleton's Carbon Footprint
Energy produced from non-renewable sources is causing a build-up of greenhouse gas emissions in the atmosphere. This build-up of greenhouse gases is interfering with Earth’s climate system and driving our changing climate. The main sources of emissions are energy use, transport, and industrial processes.
To reduce Singleton’s emissions, we need to understand how much we are producing and where they are being produced. The emissions produced in the local government area (LGA) are obtained through Snapshot Climate. The emissions directly produced by Council operations, including electricity, gas and fuel usage, are tracked in Council’s sustainability program Kinesis.
Singleton Council reports on the emissions produced by Council and the local government area through its State of the Environment Report 2017-2021. This article provides a summary of Singleton’s emissions, known as our ‘carbon footprint’.
Singleton Local Government Area (LGA)
On average, the Singleton LGA produces over 1.6 million tonnes of CO2-e each year. Following a three-year decreasing trend, emissions increased slightly in 2018-19 by 2% to 1.7 million tonnes of CO2-e (Fig. 1). This may be due to additional emissions produced by bushfires in the region. Electricity usage is the biggest source of emissions in the region, accounting for 75% of emissions (Fig. 2).
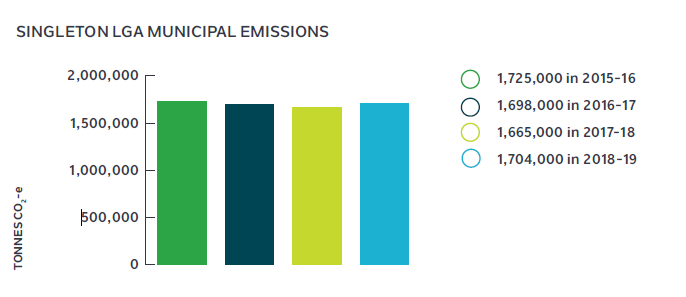
Figure 1. Emissions for Singleton LGA overtime (Ironbark Sustainability 2019).
Note: Excludes land use data. Inclusive of local power stations and mining operations.
Figure 2. Municipal emissions for Singleton LGA by source 2018-19 (Ironbark Sustainability
2019). Note: Excludes land use data. Inclusive of local power stations and mining operations.
Note: The emissions reported above may differ to the emissions reported on Snapshot Climate due to changes in data sources and emissions calculation methodologies overtime. Data is correct at time of reporting in the Singleton Council’s State of the Environment Report 2017-2021.
Renewable energy in the community
Every fifth home in Singleton now has solar panels. This is growing by 3%, about 293 homes, every single year. Relative to population size, Singleton LGA has high solar uptake compared to other LGAs in the Hunter Central Coast region. Singleton’s rate of solar increase from 2017-18 to 2019-20 is third highest in the Hunter region, behind Maitland and Cessnock LGAs.
What you can do?
Help tackle climate change by reducing your personal carbon footprint:
- Switch off appliances at the wall when not in use. Around 15% of household power is drawn from appliances that we think are turned off but are actually on stand-by, continuing to draw power.
- Choose energy efficiency appliances with an energy-star rating of four stars or more.
- Hang your clothes on the line or a drying rack rather than a dryer. Clothes dryers account for 12% of electricity usage in a typical household.
- Consider installing solar panels on your home or purchasing green power if you are renting.
- Every journey counts. Walk, ride, carpool or use public transport over a personal vehicle where possible.
- If you have a wood heater, get your chimney flue checked and cleaned once a year and only use small logs of dry, untreated wood. Don’t let your fire smoulder overnight. Consider replacing your wood heater with an energy efficient air conditioning system.
- Switch off your car engine while parked to reduce emissions.
Ensure your vehicle is serviced regularly. Vehicles with worn engines or engine and fuel system problems can emit excessive smoke, a major contributor to particle pollution.
Singleton Council
Council produces greenhouse gas emissions through fuel usage (Scope 1) for its fleet and plant equipment and purchased electricity usage (Scope 2) to power our community’s street lighting, pump stations and facilities.
In 2020-21, Singleton Council’s emissions decreased by 29% compared to 2019-20, Council’s lowest emissions in four years (Fig. 3).
The higher emissions recorded during 2018-19 and 2019-20 were primarily due to increased electricity demand at Council’s Gouldsville Pump Station because of the extensive drought period in the region and local mines sourcing additional water supply. Council’s diesel usage also increased slightly in 2019-20. This is possibly due to above average plant usage during the COVID-19 pandemic because of social distancing requirements in vehicles. During the same period, Council’s gas usage dropped significantly due to the temporary closure of the Gym and Swim Centre and Visitor Information Centre also due to COVID-19 restrictions.
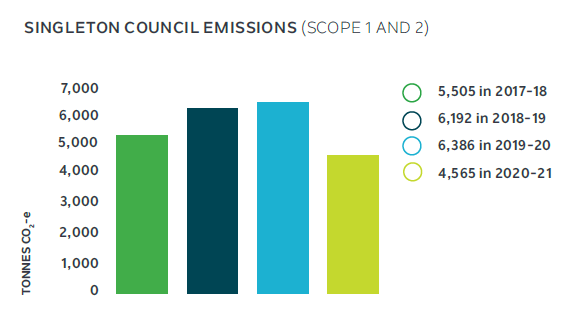
Figure 3. Council CO2-e emissions. Note: Includes Scope 1 (fuel usage) and Scope 2
(electricity usage) emissions.
Renewable energy at Singleton Council
Renewable energy usage at Council has increased by 142% between 2019-20 and 2020-21.
Singleton Council has installed solar photovoltaic systems on the following Council facilities:
- Gym and Swim (220.40k)
- Sewer Treatment Plant (210.6Kw)
- Whittingham Booster Pump (10.10kW)
- Administration Building and Auditorium (99.50kW)
- Colleen Gale Children’s Centre (10.10kW)
- Library (35.10kW)
- Visitor Information Centre (35.10kW)
- Waste Management Facility (10.10kW)
- Youth Venue (7kW)
- Waste Depot (6.63kW)
- Water Treatment Plant (35.10kW)
- OOSH (10.10kW)
- State Emergency Service Building (6.5kW)
- Animal Management Facility (6.6kW)
- Arts and Culture Centre
What is Council doing?
- Council purchases 50% of its electricity from the Moree Solar Farm.
- Implemented an energy efficient lighting upgrade at Howe Park. Using an app, clubs can control lux (lighting intensity). This means more efficient low lighting can be used 90% of the time, and more intense lighting can be turned on for night cricket and football games.
- Installed solar panels on 12 facilities identified as having the highest energy consumption including the Administration Building, Library, Gym and Swim, Visitor Information Centre and Waste Management Centre. The project will save $126,652 in energy costs each year and reduce emissions by 898 tonnes of CO2-e per year. This is the equivalent of taking 370 cars off the road each year.
- Installed 698 LED lights throughout 10 Council facilities, reducing CO2-e emissions by 210 tonnes each year.
- Installed 854 energy efficient LED lights as part of the Street Lighting Improvement Program established by the Southern Sydney Regional Organisation of Councils (SSROC). This is projected to decrease energy usage and emissions from street lighting by over 78%. This is a reduction of approximately 245 tonnes of CO2-e each year.
- Overall, Council’s electricity usage decreased by 31% and emissions by 29% in 2020-21, compared to the previous year.